Observation of anodizing pore structure
Question
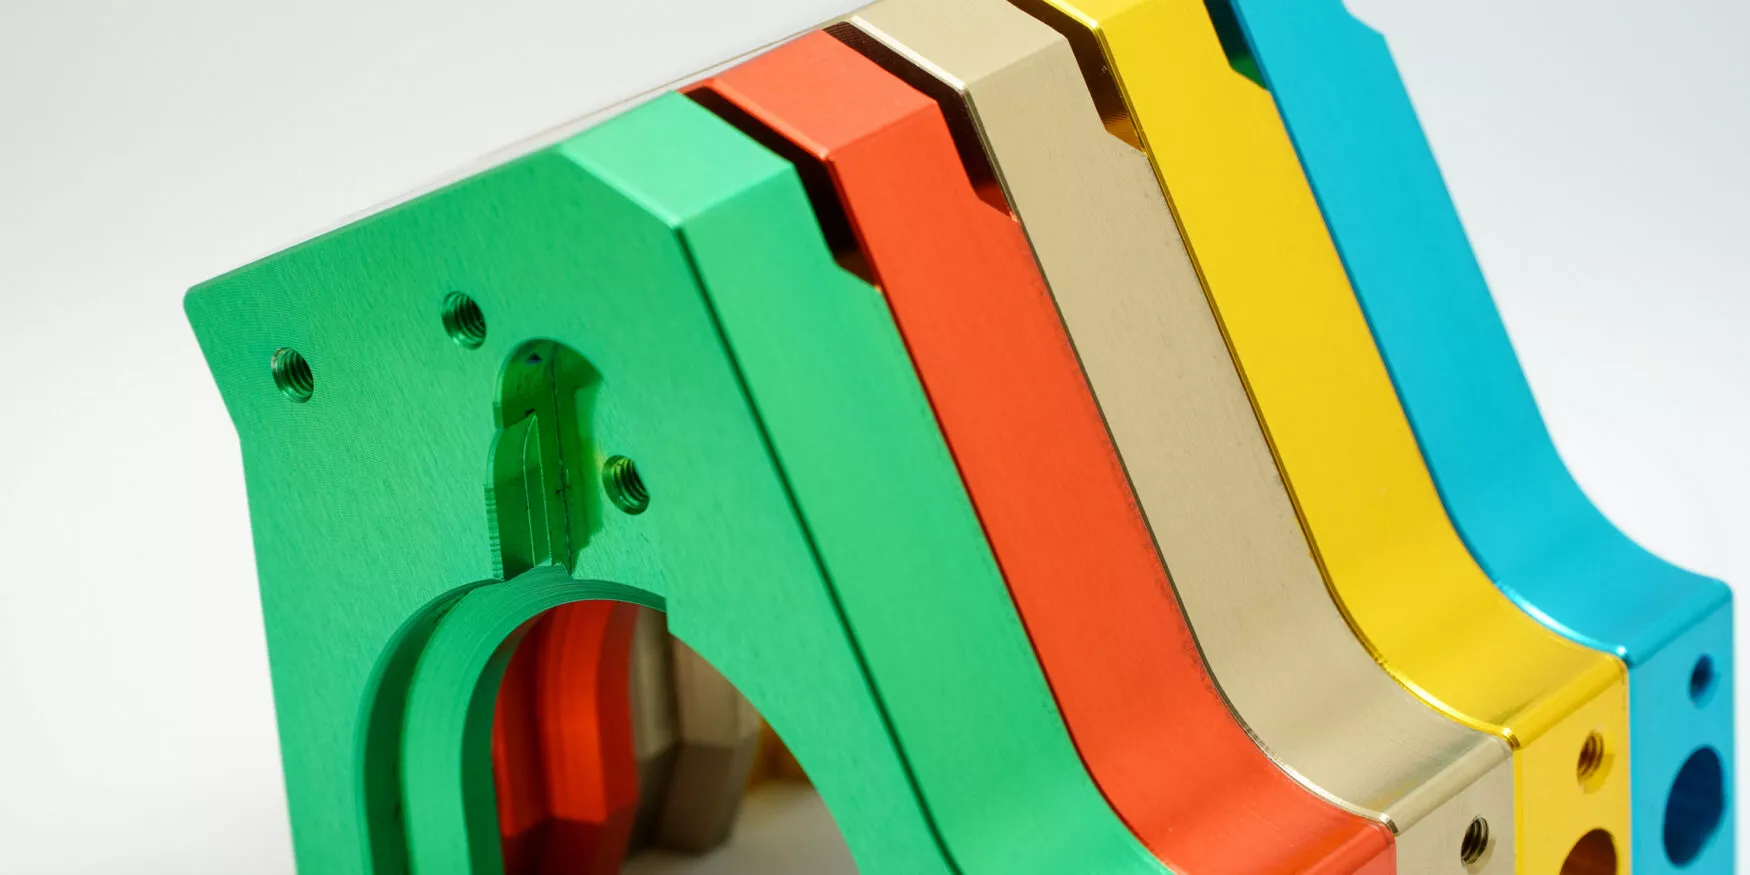
Anodizing is a surface treatment commonly applied to aluminum, titanium or other metals that can be passivated. This anodic oxidation can enhance corrosion resistance, improve hardness and abrasion resistance, reduce the coefficient of friction, increase the adhesion of an end-coating or simply modify the appearance (colorless or tinted) of the surface.
Depending on the electrolyte used, anodizing can lead to the formation of a porous columnar structure that can, for example, be impregnated with a colorant.
How can we characterize the porous structure obtained by anodizing in order to optimize it?
Expertise
Materia Nova has extensive expertise in the anodizing process [Anodisation - Materia Nova - innovation center] and pilot-scale development capabilities [Ligne pilote de galvanisation et d'anodisation (450mm*300mm*300mm) - Materia Nova - innovation center]. Surface preparation, bath composition and quality, and application conditions define the size, shape, thickness and composition of the porous layer. Here, we present how to characterize the nanometric structure of a porous anodizing layer.
Simple “macroscopic” tests are often carried out to check the quality of the layers produced. These techniques are generally insufficient for the development and optimization of new processes. Indeed, it is essential to be able to observe and characterize the fine structure of pores and their composition: average pore size and surface density are key parameters for process control. This is particularly critical when high hardnesses are required or when aesthetics are paramount.
The pores are observed using a high-resolution Scanning Electron Microscope (SEM) [Microscope Electronique à Balayage (MEB) - Materia Nova - innovation center] . The figure below shows a cross-sectional image of the anodized layer after cryofracture of the sample:
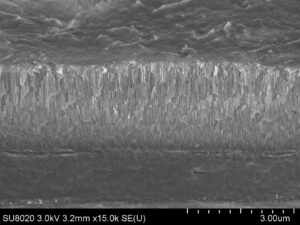
The columnar structure is clearly visible in this image. The average layer thickness is 2.4 µm. Seen from above (below, left-hand image), the open pores are clearly visible. Images obtained at high magnification are reprocessed with analysis software (image on right) to determine average pore size, pore distribution and surface density.
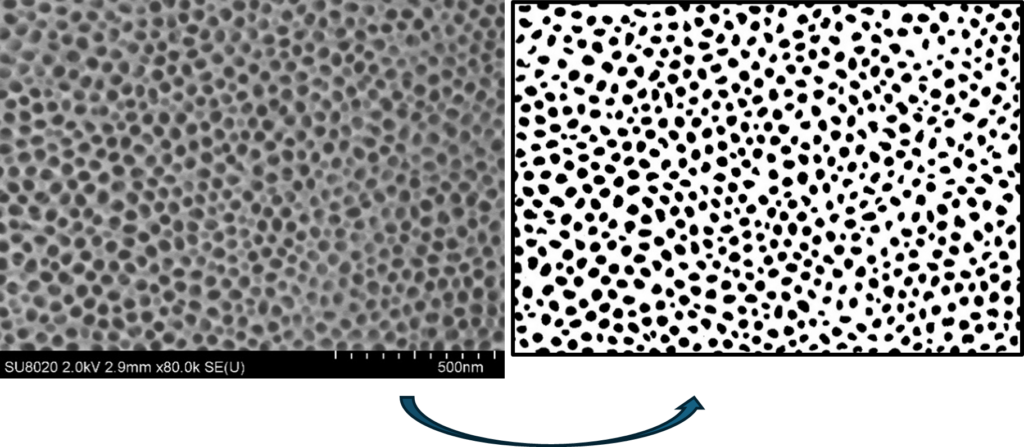
Image processing
The surface density obtained from the processed image is 30%.
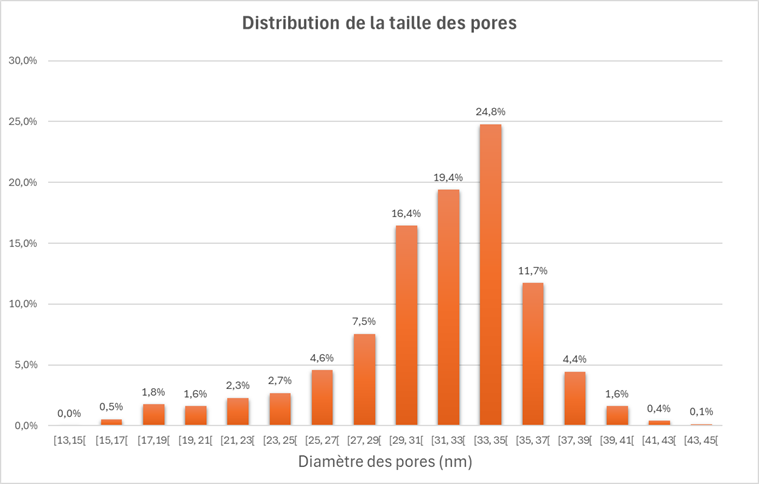
The following graph illustrates the size distribution. In this case, the average pore diameter is 34 nm. A quarter of pores have a diameter between 33 and 35 nm. Around 56% of pores have a diameter of +/- 3 nm around the mean value.
Solution
Materia Nova has the equipment and technical skills to characterize the porosity of anodizing layers in detail, in order to optimize their morphology.